Homework 2
Assignments Homework
Background
For this homework, we will use a dataset on adolescent alcohol use collected by Curran et al., which includes three waves of data on 82 adolescents. Below is some additional information about the data.
- Waves of data were collected annually, begining at age 14
alcuseis the outcome, ranging from 0 (“not at all”) to 7 (“every day”). A square root transformation has been applied.coais a dummy variabe indicating whether or not the participant was the child of and alcoholic.peeris measure of alcohol use among the participant’s peer group. Similar to the outcome, a square root transformation has been applied.
1: Data
Read in the data and conduct any data prep work needed. Specifically, we will be fitting a number of different growth models in this homework, so you’ll need to think about how you’re going to code time.
2: Initial fits
Fit a model with random intercepts and parallel slopes. Compare the fit of this model to a one with random intercepts and random slopes. Describe which model you believe fits the data better, and provide evidence to justify this conclusion.
3: Alternative residual VCOV
Use Generalized Least Squares (gls) to re-estimate the model with (a) autoregressive, (b) heterogeneous autoregressive, and (c) Toeplitz structures. Compare the composite residuals from these models with the composite residual from the random slopes model fit in Question 2.
4: Comparing models
Compare the fit of all models. Which model does the evidence suggest provides the best fit to the data?
5: Adding predictors
Include coa and peer as predictors in the model. Evaluate whether adolescents alcohol use trajectories (slopes) depend on these variables. You can extend your {lme4} model or your gls() model, regardless of your conclusions from above. Provide a brief summary of your findings (you do not have to interpret the entire model, just whether or not the trajectories depend on coa and/or peer).
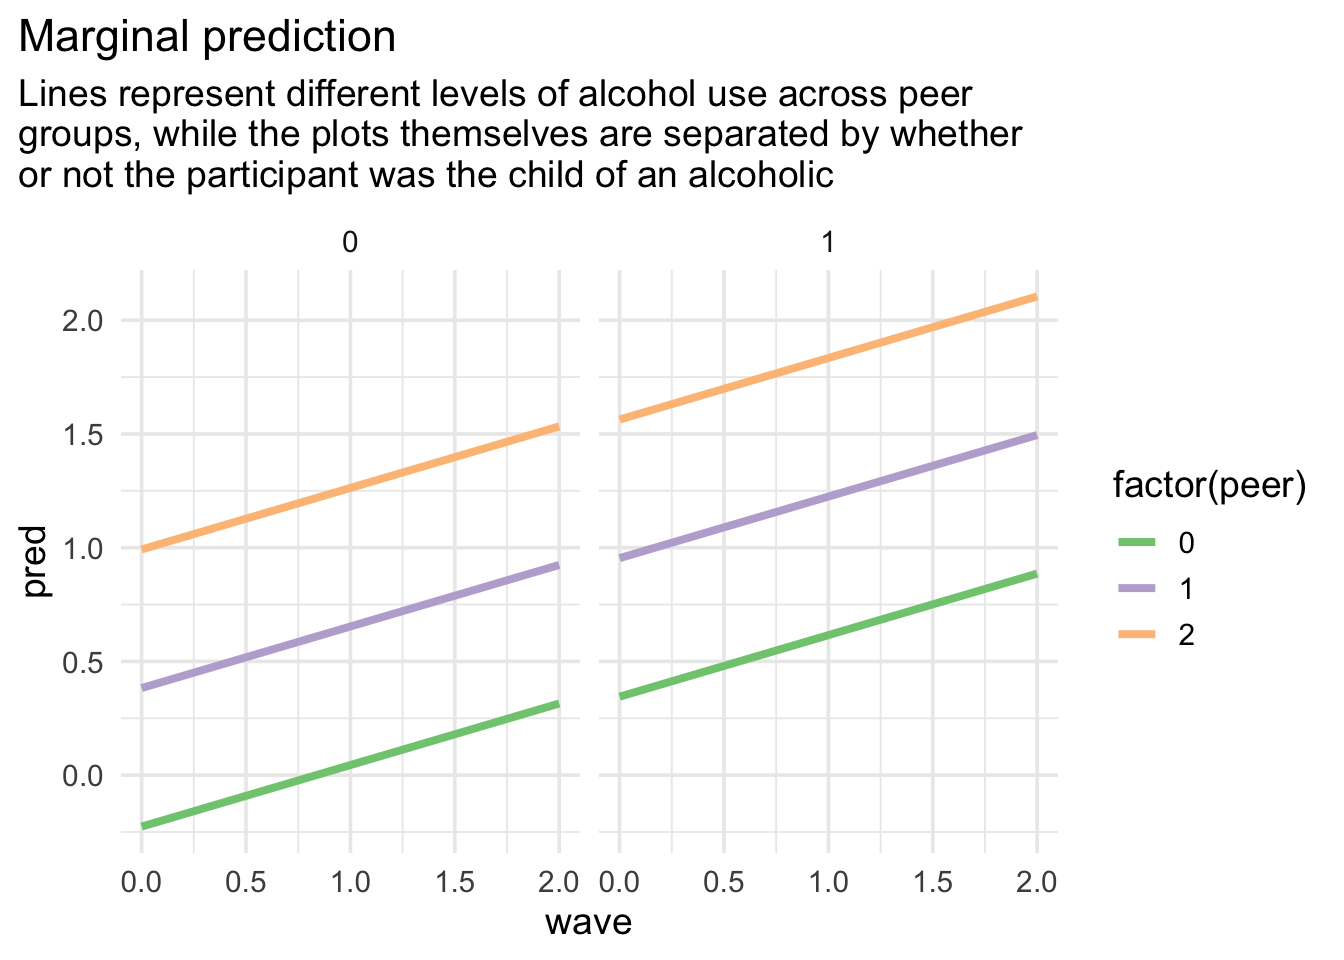
6: Plots
Produce the following plot. Don’t worry about differences in the theming. Just get the basics structure. Note, I’m using the model that I felt displayed the best fit to the data to make my predictions.