Homework 3
Assignments Homework
Read in the "thai-education.csv" file. It should look like the below.
## # A tibble: 7,516 x 5
##    schoolid sex   pped  repeated_grade msesc
##       <dbl> <chr> <chr> <chr>          <dbl>
##  1    10103 girl  no    no              0.88
##  2    10103 girl  no    no              0.88
##  3    10103 girl  yes   no              0.88
##  4    10103 girl  yes   no              0.88
##  5    10103 girl  yes   no              0.88
##  6    10103 girl  yes   no              0.88
##  7    10103 boy   yes   no              0.88
##  8    10103 boy   yes   no              0.88
##  9    10103 boy   yes   no              0.88
## 10    10103 boy   yes   no              0.88
## # … with 7,506 more rows
These variables represent the following:
schoolid: School identification numbersex: The coded sex of the studentpped: An indicator of whether the student attended preschool or notrepeated_grade: Whether or not a student repeated a grade levelmsesc: The mean socioeconomic status at the school.
Throughout this homework, we will address the following research questions
Disclaimer
I am leaving the full homework here. However, you are only required to address the following question:
Does the relation between students' coded sex and likelihood of repeating depend upon the mean SES at the school level?
You must use Bayesian estimation, and provide evidence to justify your conclusion. Make sure to also account for between-school variability in the baseline log-odds of a student repeating a grade.
The rest
If you would like additional practice, you can address the remaining questions
RQ1: To what extent does the likelihood of repeating a grade vary between schools?
RQ2: Does the coded sex of the student relate to this likelihood?
RQ3: Does the relation between students' coded sex and likelihood of repeating depend upon the school in which they are enrolled?
Research Question 1
RQ1, Part 1
Use the data to fit a model to address the first research question. Use maximum likelihood estimation. Note - you may run into some convergence issues. Use the troubleshooting skills we’ve talked about to modify the model so it converges without warning.
RQ1, Part 2
After fitting the model, provide a brief interpretation of the model and the coefficients.
RQ1, Part 3
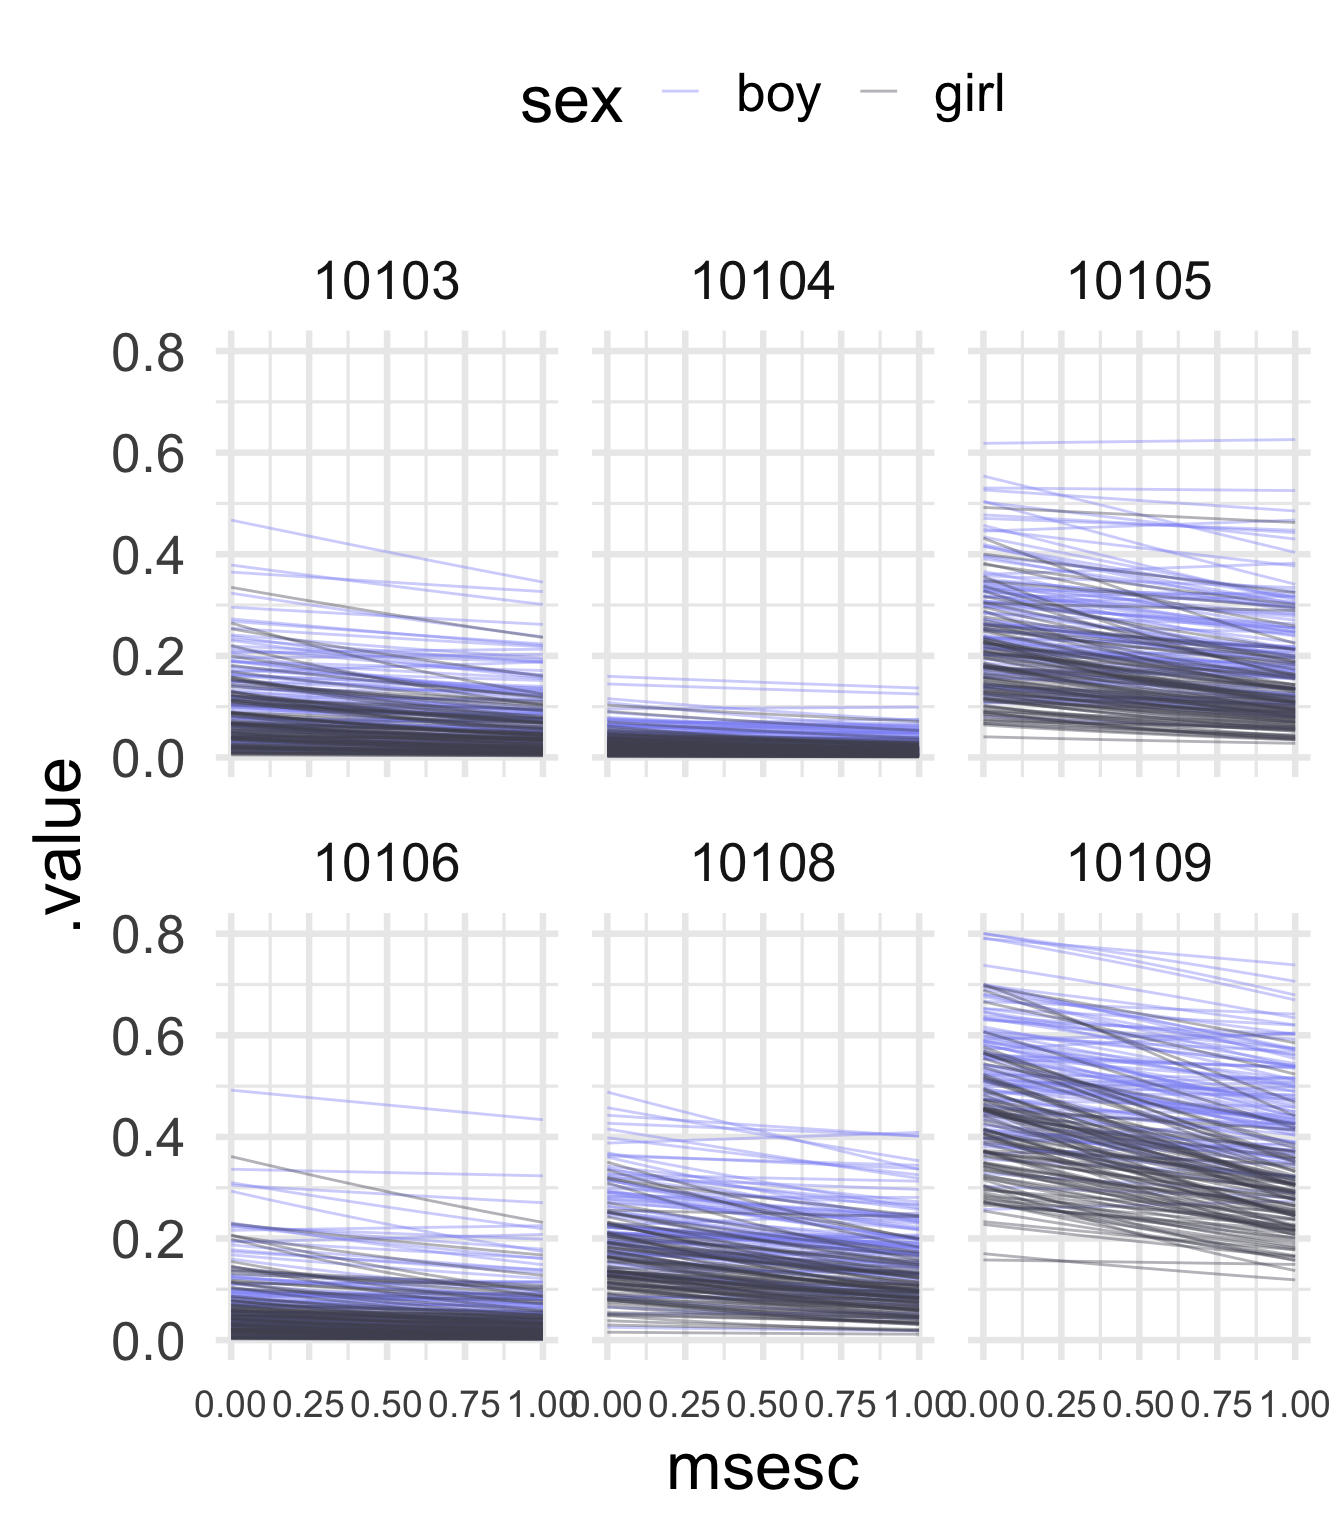
Use the fitted model to display the variability between schools in terms of the probability of students repeating a grade. It should look something like the below.
Research Question 2 & 3
RQ2/3, Part 1
Building more complicated models will result in convergence issues that are difficult to solve via maximum likelihood. Fit model(s) to address Research Questions 2 and 3 using Bayesian estimation. Assume default, flat priors.
Conduct diagnostic checks on these model(s) to make sure there were no issues with convergence.
RQ2/3, Part 2
Provide a brief interpretation of the model. For this section, focus primarily on the mean of the primary parameters you’re estimating (i.e., the estimates when you call summary()), along with the credible intervals around those means.
RQ2/3, Part 3
Compare the two Bayesian fits using leave-one-out cross-validation (LOO). What do you conclude?
Final Research Question
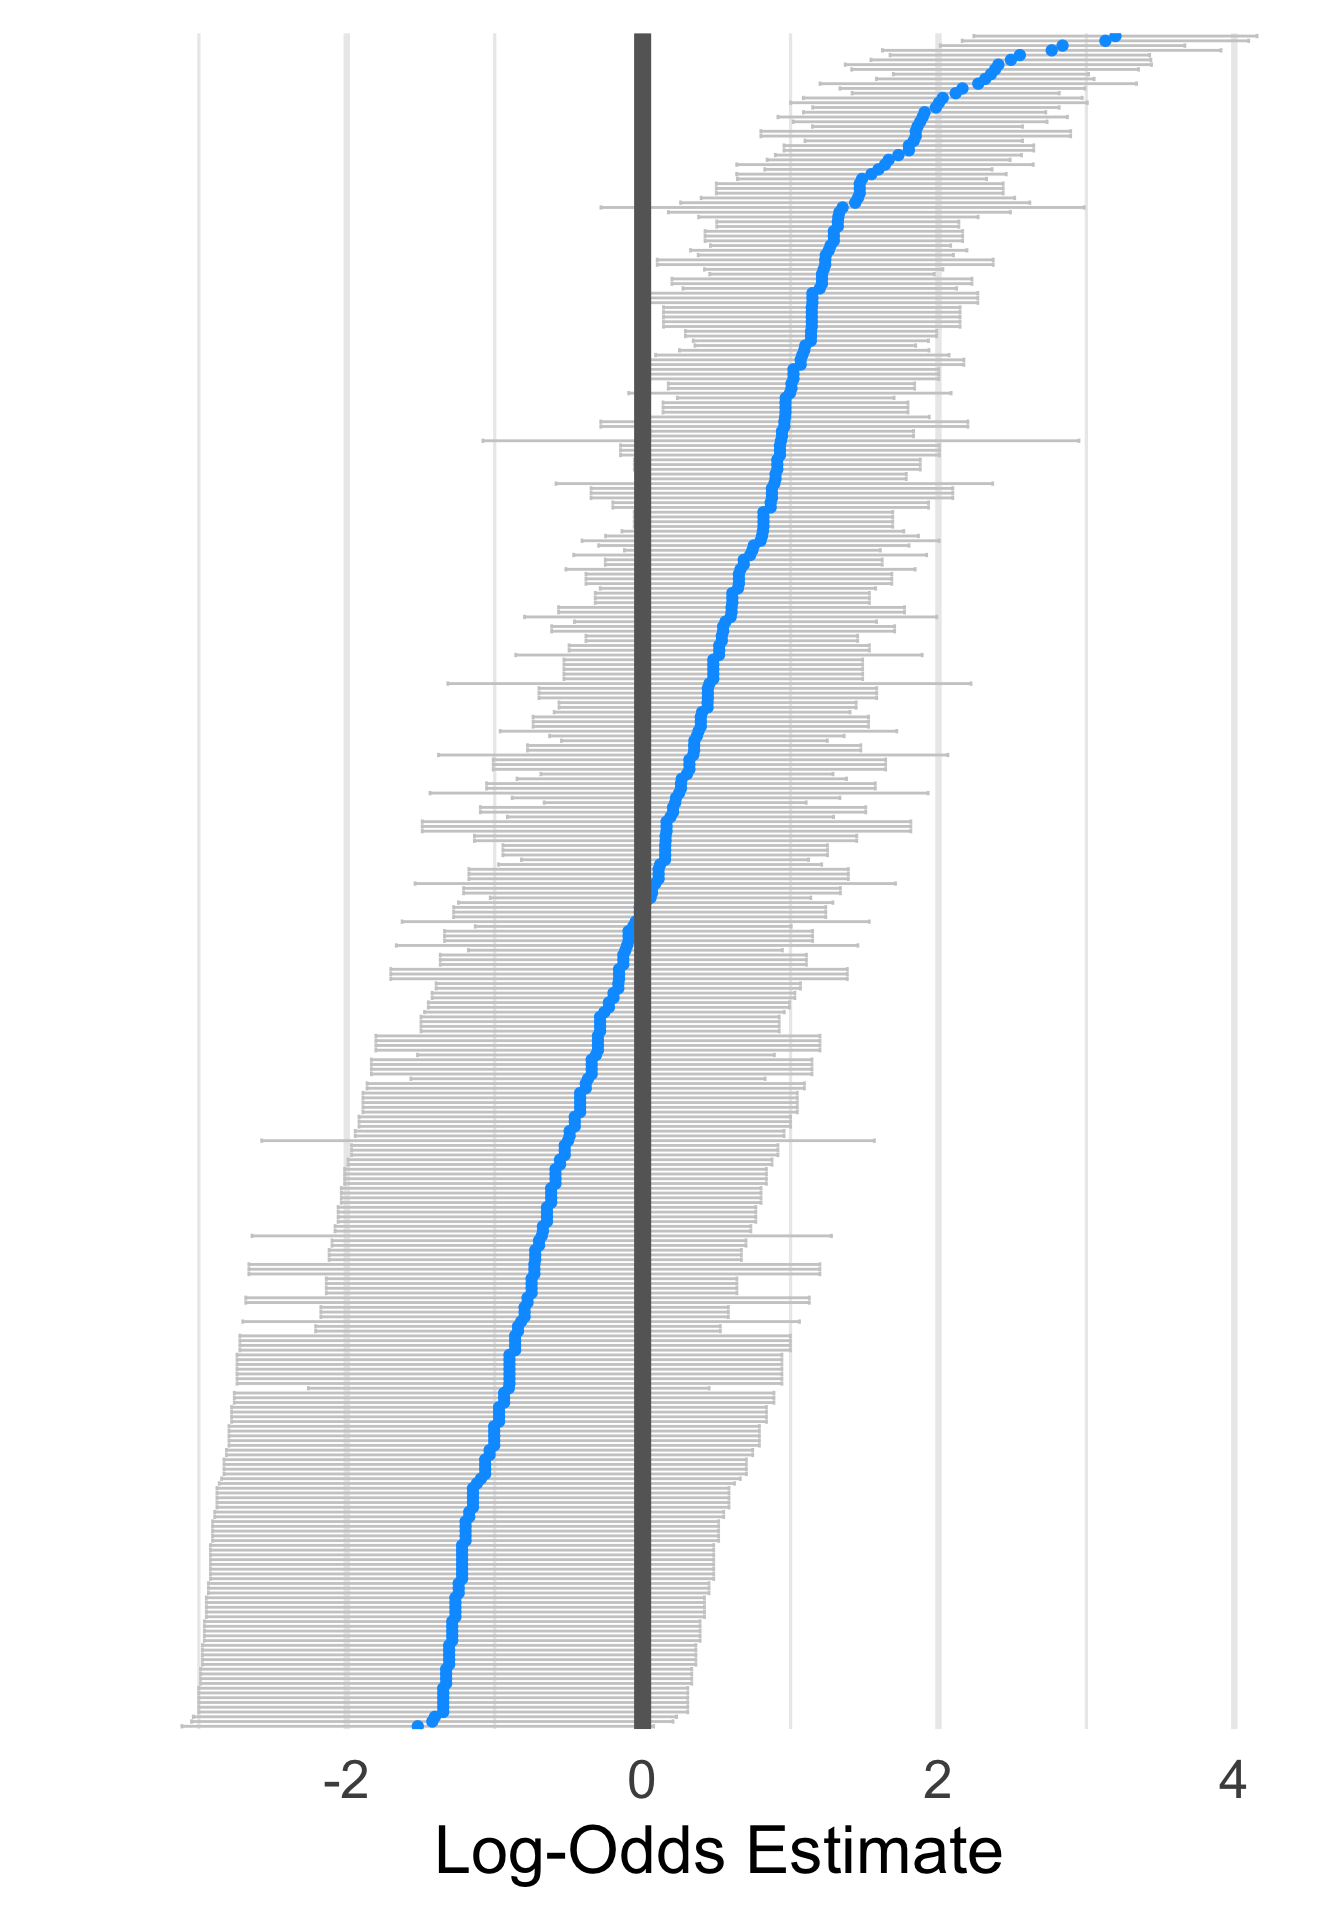
This is the only required research question you must address. You must only address the parts mentioned in the disclaimer part above. If you would like additional practice, please try to replicate the plot below. As always, don’t worry about styling of the plots. Just replicate the important parts.